Introduction
In March 2023, Credit Suisse collapsed — not simply because of bad bets, but partly because the bank’s leadership lacked a timely, consolidated view of its own risk exposure. Regulators and analysts later noted that critical risk data sat in siloed, disconnected systems, making it nearly impossible to see the full picture until it was too late.
You might not be running a global investment bank. But whether you’re a risk analyst at a regional lender, a compliance officer at an insurer, or a data engineer building pipelines for the first time, you face the same underlying challenge: how do you get reliable, accurate, timely risk data from dozens of messy sources into the hands of the people who need it — before something goes wrong?
The answer, in 2026, is a Risk Data Pipeline.
In this article, you’ll learn exactly what a risk data pipeline is, why it’s fundamentally different from an ordinary data pipeline, what it looks like inside, and how to start building one. No prior deep technical knowledge required. Just a curiosity about how organizations tame the chaos of risk data — and a willingness to think differently about data plumbing.
What Exactly Is Risk Data?
Before we build a pipeline, we need to understand what flows through it.
Risk data is any data used to identify, measure, monitor, or report on the risks an organization faces. It’s not one type of data — it’s a broad family, including:
- Market risk data: Interest rates, foreign exchange rates, equity prices, commodity prices, volatility indices. This data moves by the millisecond and drives Profit & Loss (P&L) calculations, Value-at-Risk (VaR) models, and stress tests.
- Credit risk data: Borrower information, credit scores, loan-to-value ratios, payment history, collateral details, and counterparty exposure. Used to assess the likelihood that a borrower will default.
- Operational risk data: Incident logs, process failure records, fraud alerts, system outages, and near-miss reports. Everything that can go wrong inside an organization.
- Liquidity risk data: Cash flow projections, funding gap analyses, and real-time positions in liquid assets. Critical during market stress when funding can dry up overnight.
- ESG and climate risk data: Carbon emissions, flood-zone property exposure, supply-chain sustainability ratings, and climate scenario analysis inputs. A fast-growing category driven by regulation and investor demand.
- Regulatory and compliance data: KYC (Know Your Customer) records, AML (Anti-Money Laundering) alerts, sanctions screening results, and regulatory capital ratios.
Why Is Risk Data Uniquely Challenging?
Compared to regular sales data or customer demographics, risk data is harder to work with for several reasons:
It’s time-critical. A market risk position that’s 15 minutes stale during a volatile trading session is dangerously misleading. Regulators increasingly expect intraday or even real-time reporting.
It’s high-stakes. A data quality error in your sales report costs you a bad quarterly chart. A data quality error in your credit risk model can trigger wrong capital allocations, regulatory penalties, or catastrophic losses.
It’s heavily regulated. Regulators (the Basel Committee, the SEC, the ECB, and others) have explicit rules about how risk data must be collected, validated, stored, and reported. Getting it wrong doesn’t just hurt the business — it can result in fines, sanctions, or forced capital raises.
It comes from everywhere. A single risk calculation might need to pull together data from a core banking system, a market data vendor, a counterparty management platform, a spreadsheet maintained by a business analyst, and a third-party credit bureau. Reconciling these sources is genuinely hard.
First, What Is a Data Pipeline?
Think of a data pipeline like a water pipeline in a city. Water starts at a source (a reservoir, a river), gets treated and purified at a treatment plant, travels through underground pipes, and finally arrives — clean and safe — at your tap. You don’t think about any of that complexity when you turn the faucet. You just get clean water.
A data pipeline does the same thing for data. It moves data from its raw sources, transforms and cleans it, and delivers it to the people or systems that need it — reports, dashboards, models, or regulatory submissions.
The classic framework is called ETL — Extract, Transform, Load:
- Extract: Pull raw data from source systems (databases, APIs, flat files, streaming feeds).
- Transform: Clean, reshape, validate, enrich, and aggregate that data into a usable form.
- Load: Store the processed data somewhere useful — a data warehouse, a data lake, or directly into an application.
A more modern variant is ELT (Extract, Load, Transform), where raw data is loaded first and transformed later using tools like dbt (data build tool). This approach suits cloud-scale environments where storage is cheap and compute is flexible.
That’s the foundation. Now let’s add the complexity of risk.
So, What Makes It a Risk Data Pipeline?
A Risk Data Pipeline is a data pipeline that is specifically engineered to handle the collection, processing, governance, and delivery of risk data — with all the extra care, precision, and compliance requirements that entails.
Think of it like the difference between a household garden hose and a hospital’s sterile IV line. Both move liquid, but the hospital version is held to an entirely different standard: precise measurements, documented provenance, zero contamination, real-time monitoring, and full traceability if something goes wrong.
A risk data pipeline has five defining characteristics that set it apart:
1. Accuracy and completeness. Risk calculations are only as good as the data underneath them. A missing position, a wrong FX rate, or a duplicate trade can cascade into massively incorrect capital requirements or risk reports.
2. Data lineage and auditability. Regulators and auditors need to trace every number back to its source. If your VaR report says your market risk is $12 million, you must be able to show exactly where every data point came from, every transformation applied to it, and every system it passed through. This is called data lineage.
3. Timeliness. Risk data must arrive when it’s needed — not the next day. Regulatory frameworks increasingly demand near-real-time or intraday reporting.
4. Regulatory compliance. The gold standard for risk data management is BCBS 239 — the Basel Committee on Banking Supervision’s Principles for Effective Risk Data Aggregation and Risk Reporting, first published in 2013 and still the benchmark in 2026. It mandates that banks demonstrate data accuracy, integrity, completeness, timeliness, and adaptability. Any serious risk data pipeline must be designed with BCBS 239 in mind.
5. Governance. Who owns the data? Who approved the transformation logic? Who changed the validation rule last Tuesday, and why? Risk data pipelines require robust governance frameworks — clear ownership, documented decisions, and change control processes.
“In risk management, the pipeline itself is part of the evidence. If you can’t show regulators how data moved and was transformed, the output means nothing.”
Anatomy of a Risk Data Pipeline: The Key Components
Let’s open the hood and look at the key components. Picture an assembly line in a factory — each station has a specific job, each station feeds the next, and quality is checked at every step.
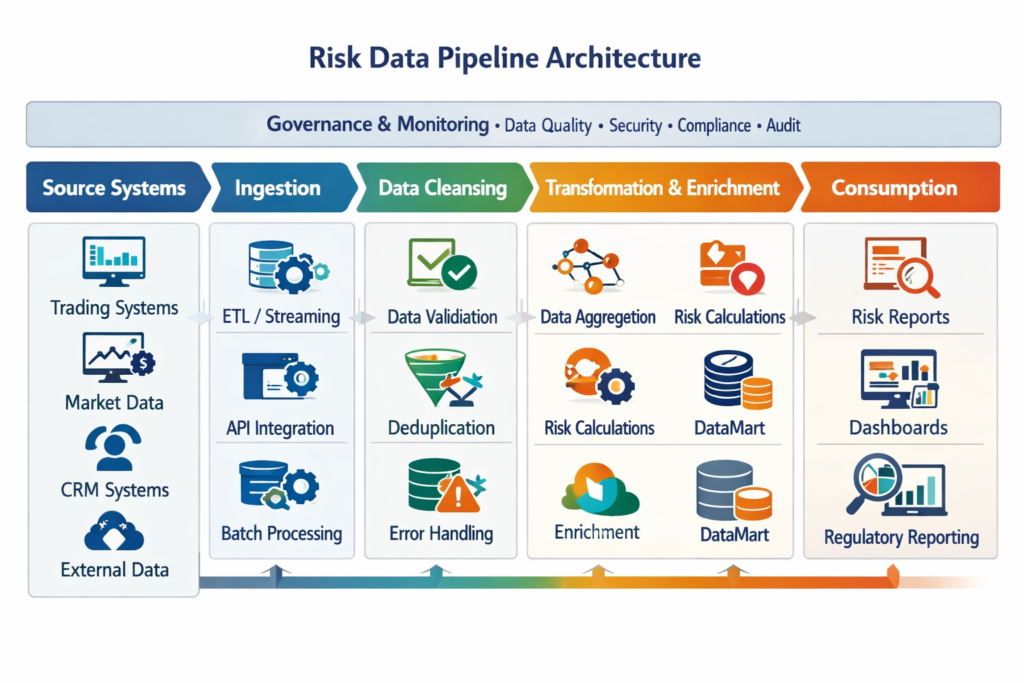
1. Data Sources & Ingestion
This is where the pipeline starts. Risk data enters from a wide variety of sources:
- Internal systems: Core banking systems (like Temenos or Finastra), trading platforms, loan origination systems, general ledger systems, and risk engines.
- External providers: Bloomberg, Refinitiv (LSEG), ICE, credit bureaus (Experian, Equifax), ESG data vendors (MSCI, Sustainalytics).
- Flat files: CSV files, Excel workbooks, fixed-width text files — often from legacy systems or business users.
- APIs and streaming feeds: Real-time market data, payment event streams, fraud signals.
Ingestion methods range from batch loads (running once a day overnight) to streaming ingestion using tools like Apache Kafka or AWS Kinesis for near-real-time data.
2. Cleansing, Validation & Enrichment
Raw risk data is rarely clean. This stage does three jobs:
- Cleansing: Removing duplicates, fixing formatting errors, handling nulls, standardizing date formats and currency codes.
- Validation: Checking business rules — Is this interest rate within a plausible range? Does the trade notional match between the front-office system and the back-office system? Are all mandatory fields present?
- Enrichment: Adding context — mapping a counterparty ID to its legal entity, appending credit ratings, tagging a loan with its regulatory asset class.
This is often the most time-consuming stage, and it’s where the most risk data problems hide.
3. Transformation & Aggregation
Once data is clean, it needs to be reshaped for use:
- Transformation: Calculating derived metrics — P&L, Exposure at Default (EAD), risk weights, stressed scenarios.
- Aggregation: Rolling up position-level data to portfolio, desk, business unit, or entity level. This is core to risk data aggregation, one of the key BCBS 239 requirements.
Tools like Apache Spark, Apache Flink, and dbt are commonly used at this stage, depending on the scale and latency requirements.
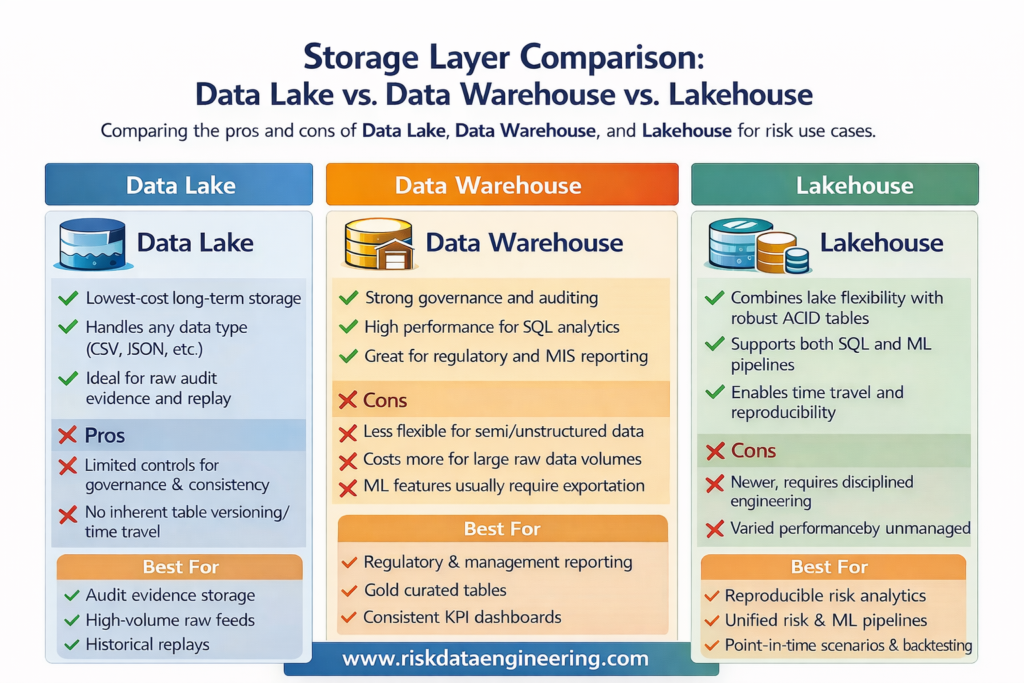
4. Storage (Data Lake, Warehouse, Lakehouse)
Processed risk data needs to be stored for reporting, analysis, and regulatory submission:
- Data Lake: Raw and processed data stored cheaply in object storage (S3, Azure Data Lake), ideal for large volumes and historical archives.
- Data Warehouse: Structured, query-optimized storage for reporting and dashboards — platforms like Snowflake, Google BigQuery, or Azure Synapse dominate here in 2026.
- Data Lakehouse: A hybrid architecture (popularized by Databricks with Delta Lake) combining the scale of a data lake with the query performance and ACID transaction guarantees of a warehouse. Increasingly the default for serious risk data platforms.
5. Consumption Layer
This is where risk data actually gets used:
- Risk engines: Feeding VaR engines, credit scorecards, capital calculation engines (like Murex, Finastra Fusion Risk, or custom-built models).
- Dashboards and reporting tools: Tableau, Power BI, Looker — giving risk managers and executives real-time visibility.
- ML models: Credit default models, fraud detection engines, ESG scoring algorithms.
- Regulatory reports: Automatic generation of submissions to regulators — COREP/FINREP in Europe, FR Y-14 in the US, APRA returns in Australia.
6. Monitoring, Alerting & Data Governance
Spanning the entire pipeline — not just sitting at the end — is the governance and monitoring layer:
- Data quality monitoring: Tools like Monte Carlo, Great Expectations, or Soda continuously check for anomalies, schema drift, or SLA breaches.
- Orchestration and scheduling: Apache Airflow is the industry-standard tool for scheduling, monitoring, and managing pipeline workflows, tracking dependencies and failures.
- Data catalog and lineage: Platforms like Collibra, Atlan, or Alation document what every dataset is, who owns it, where it came from, and how it’s been transformed.
- Alerting: When a market data feed goes silent, when a validation check fails above a threshold, or when a pipeline run takes twice as long as expected — automated alerts ensure someone is notified immediately.
Why Every Modern Organization Needs One
1. Regulatory Survival
BCBS 239, IFRS 9, Basel IV, DORA (Digital Operational Resilience Act in the EU), and SEC climate disclosure rules all require banks and financial institutions to demonstrate systematic, auditable, governed data processes. A well-built risk data pipeline is the infrastructure that makes compliance possible.
2. Faster, More Confident Decisions
A regional bank that moved from overnight batch risk reports to an intraday risk pipeline discovered it could see large customer concentrations forming in real time — and act before they breached limits. Decisions that previously relied on yesterday’s data now happen with this morning’s.
3. Reduced Manual Effort and Error
Before automated pipelines, risk teams at mid-sized insurers spent 40-60% of their time on manual data collection and reconciliation — copy-pasting from systems, cross-referencing spreadsheets, emailing counterparts for missing data. A pipeline automates this, freeing analysts for actual analysis.
4. Early Warning of Risk Events
A properly instrumented risk data pipeline can detect anomalies before they become crises — a sudden spike in counterparty exposure, an unusual pattern of operational incidents, a portfolio concentration limit approaching breach.
5. Consistent Numbers Across the Organization
One of the most common pain points in financial institutions is that the front office, risk management, finance, and compliance all have different numbers for the same thing. A unified risk data pipeline creates a single source of truth — one authoritative, reconciled dataset everyone draws from.
6. Faster Regulatory Reporting
Regulatory submissions that once took an army of analysts weeks to compile can be automated to near-instant generation. During stress events or regulatory inquiries, the ability to produce an accurate report in hours rather than weeks is not a luxury — it’s a competitive and operational necessity.
7. Supporting Advanced Analytics and AI
You can’t build a reliable credit default model or a climate stress testing engine on inconsistent, poorly documented data. A mature risk data pipeline creates the data foundation that makes advanced analytics and machine learning trustworthy.
8. Auditability and Trust
When regulators, internal audit, or the Board ask “How did you arrive at this number?”, a well-governed pipeline can answer that question in minutes. This auditability builds trust and protects the organization in disputes or investigations.
Common Challenges (and How to Overcome Them)
Data Quality: Garbage In, Garbage Out
The challenge: Source systems are messy. Fields are inconsistently populated. Formats change without notice. Reference data is stale.
The solution: Invest early in a data quality framework — define business rules, implement automated validation at ingestion, and establish clear escalation processes when quality thresholds are breached. Tools like Great Expectations or Monte Carlo help automate this monitoring at scale.
Legacy System Integration
The challenge: Core banking systems from the 1990s don’t have APIs. They export fixed-width flat files at 2 AM, in formats that were designed for a world that no longer exists.
The solution: Use a data integration layer — middleware or API gateways that abstract away legacy complexity. Invest in purpose-built connectors or write custom parsers, and document them rigorously. Don’t try to replace the legacy system; build a clean interface around it.
Volume, Velocity, and Variety
The challenge: A large bank processes millions of transactions daily. Market data arrives thousands of times per second. Regulatory data requires historical archives going back 7-10 years.
The solution: Design for scale from the start. Use distributed processing frameworks (Apache Spark, Flink) for large batch workloads. Use streaming platforms (Kafka) for real-time data. Choose storage layers that separate hot data (fast, recent) from cold data (archived, cheaper).
Siloed Teams and Organizational Resistance
The challenge: Risk, technology, and finance teams often have different priorities, vocabulary, and incentives. Data ownership becomes political. Nobody wants to share data or fund infrastructure that “belongs” to another team.
The solution: Establish a Data Governance Council with representation from risk, technology, compliance, and finance. Define clear data ownership and accountability. Treat risk data infrastructure as shared organizational infrastructure — like office networks — not a departmental IT project.
Regulatory Pressure and Changing Requirements
The challenge: Regulatory requirements evolve constantly. What satisfies BCBS 239 today may need to be enhanced for tomorrow’s Basel IV or ESG disclosure mandate.
The solution: Build modular, flexible pipelines — not monolithic systems. Use parameterized transformations, configurable validation rules, and a data catalog that makes it easy to understand and extend the pipeline when new requirements land.
Cost and ROI Justification
The challenge: Building a serious risk data platform requires significant investment in people, technology, and time. Quantifying the return is hard when the benefit is “avoiding a fine” or “making better decisions.”
The solution: Frame the business case around three pillars — risk reduction (avoided losses and fines), efficiency gains (hours saved on manual data work), and competitive advantage (faster decisions and better risk-adjusted returns). Regulators can also be powerful allies here — a BCBS 239 compliance gap is a compelling reason to fund infrastructure.
How to Build Your First Risk Data Pipeline – Step-by-Step Guide
Building a risk data pipeline doesn’t have to be an all-or-nothing, multi-year megaproject. Here’s a practical roadmap for a mid-sized organization.
Step 1: Define Scope and Use Case
Start with one critical risk domain — say, credit risk — and one high-priority use case, such as automating daily credit exposure reporting. Don’t boil the ocean. Prove value early, then expand.
Step 2: Inventory Your Data Sources
Document every source system relevant to your use case. For each one, capture: what data it holds, what format it exports, how often it updates, and who owns it. This source inventory is the foundation of everything else.
Step 3: Define Your Data Model and Business Rules
Work with risk analysts and compliance officers to define exactly what the output data should look like, and what rules must be applied. What constitutes a valid counterparty record? How is gross exposure calculated? What are the regulatory definitions that apply?
Step 4: Design the Architecture
Choose your technology stack. A pragmatic 2026 stack for a mid-sized bank might look like:
- Ingestion: Apache Kafka (streaming) + custom Python connectors (batch)
- Processing/Transformation: Apache Spark or dbt
- Storage: Databricks Lakehouse or Snowflake
- Orchestration: Apache Airflow
- Data Quality: Great Expectations or Monte Carlo
- Data Catalog/Lineage: Collibra or Atlan
- Dashboarding: Power BI or Tableau
[Insert diagram: Sample technology stack for a mid-sized bank’s risk data pipeline, 2026]
Step 5: Build the Ingestion Layer First
Connect to your source systems, pull raw data into a staging area, and validate that you’re getting what you expect — right format, right volume, right freshness. This foundation must be solid before you transform anything.
Step 6: Build Transformation and Validation Logic
Implement your business rules, cleansing logic, and aggregation steps. Write them as code (not manual steps or spreadsheets) so they are repeatable, version-controlled, and auditable. Use dbt or Spark SQL for transformation logic, and store your rules in a central repository.
Step 7: Implement Monitoring and Alerting
Before you go live, instrument your pipeline. Define SLAs (when must the data be ready?), data quality thresholds (what failure rate is acceptable?), and alerting rules. Tools like Airflow provide built-in monitoring; complement them with a dedicated data observability platform.
Step 8: Validate with the Business and Get Sign-Off
Run the pipeline in parallel with existing manual processes. Compare outputs. Investigate and resolve discrepancies. Only when risk owners and compliance are satisfied that the pipeline produces accurate, consistent results should you decommission the manual process.
Real-World Example
Case Study: GlobalBank’s Counterparty Risk Transformation
Consider a mid-sized international bank — call it GlobalBank — that was operating with counterparty credit risk data spread across nine separate systems: a front-office trading system, two legacy back-office platforms, a credit limit management tool, a collateral management system, and four regional subsidiary ledgers.
Every morning, a team of six analysts spent four hours manually extracting, reconciling, and aggregating data into a master Excel workbook before the risk committee meeting at 10 AM. On three occasions in a single year, errors in this process resulted in incorrect exposure figures being reported to the Board and regulators — triggering costly rectification exercises and a formal regulatory notice.
GlobalBank’s technology team designed and implemented a unified risk data pipeline over 18 months. They standardized ingestion across all nine systems using Apache Kafka for near-real-time feeds and Python ETL jobs for legacy batch files. All data was landed in a Databricks Lakehouse, transformed and validated using dbt with automated Great Expectations checks, orchestrated by Apache Airflow, and catalogued in Collibra with full lineage documentation.
The results: Morning reconciliation time dropped from four hours to 12 minutes (automated). Data errors dropped by 91%. The risk committee now receives its exposure report by 7:30 AM — before markets open. Regulators, during their next examination, commended the bank’s BCBS 239 progress.
This is not a fantasy — it’s a pattern playing out across hundreds of institutions right now.
The Future of Risk Data Pipelines (2026 and Beyond)
Real-Time Streaming Becomes the Default
Batch overnight runs are being displaced. Regulators in the EU and UK are pushing for intraday capital monitoring. Trading firms already operate in microseconds. The direction of travel is clear: real-time streaming risk pipelines using Apache Flink, Kafka Streams, and cloud-native event platforms will become the standard for Tier 1 financial institutions within five years.
AI and ML Automation
Machine learning is moving from the consumption layer (models that use risk data) into the pipeline itself. Anomaly detection models now automatically flag suspicious data quality issues that rule-based validators miss. Intelligent imputation algorithms fill missing values using statistical context rather than hard-coded defaults. Expect AI-assisted pipeline monitoring to become ubiquitous.
Climate Risk Integration
ESG and climate data is now a first-class citizen in risk data infrastructure. Regulatory mandates — the EU’s CSRD, the ISSB standards, and central bank climate stress testing requirements — mean that physical risk data (flood maps, temperature projections) and transition risk data (carbon pricing, policy scenarios) must be systematically integrated alongside financial risk data.
Generative AI for Scenario Generation
One of the most exciting developments in 2025-2026 is using Large Language Models (LLMs) to assist with scenario generation for stress testing. Instead of relying solely on a finite library of pre-defined regulatory scenarios, risk teams are experimenting with generative AI to create novel, plausible stress scenarios — from pandemic-like shocks to geopolitical supply chain disruptions — and feed them into quantitative models. The pipeline infrastructure that delivers clean, well-governed risk data is the prerequisite for any such AI application.
Regulatory Evolution
Basel IV is in full implementation. DORA mandates operational resilience data reporting in the EU. Climate stress testing is becoming an annual regulatory exercise in many jurisdictions. The regulatory data burden is only increasing — making robust, adaptable risk data pipelines not a nice-to-have but an operational survival requirement.
Conclusion
Risk data pipelines are the invisible infrastructure that separates organizations that can see around corners from those who only find out what happened after the fact. When Credit Suisse collapsed, when SVB failed, and when other institutions have stumbled, data infrastructure failures — siloed data, slow aggregation, manual processes — were rarely far from the story.
Here are your key takeaways:
- Risk data is different. It is time-critical, high-stakes, heavily regulated, and extraordinarily complex — requiring far more rigor than ordinary business data pipelines.
- A risk data pipeline is an end-to-end system — from raw source extraction through cleansing, transformation, storage, and consumption, with governance and monitoring woven throughout every stage.
- BCBS 239 is your design compass. Accuracy, completeness, timeliness, lineage, and adaptability — these principles should guide every architectural decision you make.
- Start small, but think big. Pick one critical use case, prove value, and expand. The biggest mistake is trying to build everything at once and delivering nothing.
- The future is real-time, AI-augmented, and climate-aware. The organizations investing now in flexible, modern risk data infrastructure are the ones that will navigate tomorrow’s regulatory and market environment with confidence.
Your next step? Look at one risk report your organization produces manually or semi-manually today. Ask: Where does this data come from? How is it transformed? How would I know if it was wrong? That’s your starting point — and the beginning of your risk data pipeline journey.
Further Reading
- BCBS 239 – Principles for Effective Risk Data Aggregation and Risk Reporting (Basel Committee on Banking Supervision) — The foundational regulatory framework every risk data practitioner should read.
- “Fundamentals of Data Engineering” by Joe Reis & Matt Housley (O’Reilly, 2022) — Excellent foundation on data pipeline architecture applicable to risk contexts.
- The Data Management Body of Knowledge (DMBOK2) by DAMA International — Comprehensive reference for data governance, quality, and management.
- Databricks Documentation: Delta Lake and the Lakehouse Architecture — Practical reference for modern risk data storage patterns. Available at docs.databricks.com.
- Apache Airflow Documentation and Community — Essential for anyone building and orchestrating risk data pipelines. Available at airflow.apache.org.
© 2026 | Written for practitioners building the future of risk data infrastructure. Feedback and contributions welcome.